
Data visualisation
Choropleth Bangladesh Map
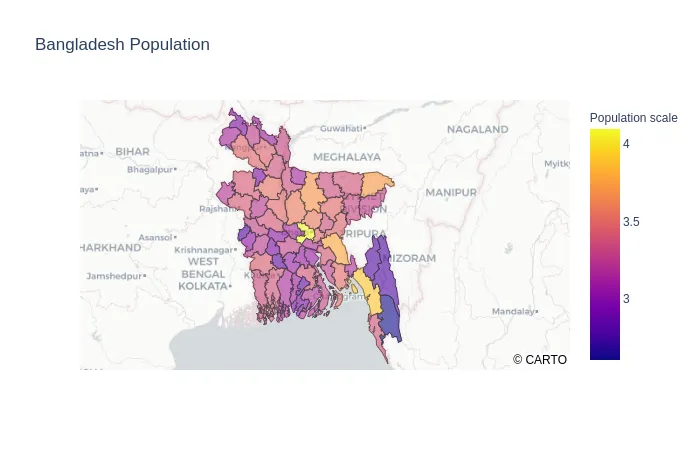
A choropleth map of Bangladesh's population density, built to make a national dataset legible at district level.
- Role
- Creator
- Period
- 2021
The problem
Population data for Bangladesh is plentiful at national level and almost useless in aggregate. District-level density is the figure that matters, and it is the one that is hardest to read when it arrives as a table.
The approach
The project turns the district dataset into a map where colour carries density directly. A choropleth is the right choice for an ordered statistic across areas: it answers “where is it dense” in one glance, without a legend hunt.
The work was mostly about the data — cleaning inconsistent district boundaries, normalising the figures, and choosing class breaks that do not flatten the outliers that make the map interesting.
It is a small project with an outsized lesson: the interesting part of a map is almost never the drawing.
Engineering highlights
Class breaks do the work
Equal-interval breaks made one district dominate the legend. Choosing breaks around the actual distribution is what made the map readable.
Boundaries first
Most of the effort went into reconciling district boundaries before a single polygon was styled.
At a glance
- Resolution
- District level
- Variable
- Population density
Stack
- Python
- Pandas
- GeoPandas
- Matplotlib
- Jupyter